Timothy Rollings
Reflections and notes on systems, life, engineering, and how they evolve.
Playing with the kappa metric
Published on 2024-07-29
For the past week, I've been playing with Nassim Taleb's  -metric. Given how a lot of real-world data doesn't actually fit a "standard" normal distribution, playing with this -metric is part of a bigger exploration of mine. Namely, I'm exploring the different ways to measure what distribution a dataset best fits, whether that's the normal distribution, and other related preasymptotic behavior.
The -metric
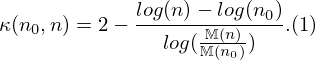
The -metric measures a distribution's rate of convergence to a Lévy  -Stable basin (Normal distribution being one) as the number
  of independent and identically distributed (i.i.d) random variables increases. In short, it tells you how much data you'd need for the data to become normally distributed.
I'll just cut to the chase with the following formula:
 is the mean absolute deviation from the mean for summands. It's calculated as follows:
![\mathbb{M}(n) = \mathbb{E}[|S_n - \mathbb{E}[S_n]|]. \text{ (2)}](../mathimg/f4daad9bda.png)
![\mathbb{E}[S_n]](../mathimg/059ed1e3ae.png) is the expected value (mean) of the summands
is the expected value (mean) of the summands  .
.
What's the -metric for Lognormal distribution?
Lognormal distributions are often mentioned with data related to things like digital marketing data, economic data, and other datasets related to somewhat scalable, complex systems. So going over the -metric related to this type of distribution is useful.
For the Lognormal distribution, a closed-form of the -metric for  is approximately the following:
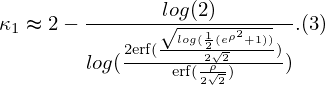
Also,  is the following error function:
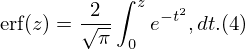
Running some quick code (link below) that uses expression  to calculate
  for
for  values between 0 and 3 for the lognormal distribution, you'll get the same plot shown in Figure 1.

Figure 1: Plot of the lognormal distribution's κ-metric as σ increases.
While it's great there's a closed-form approximation of for lognormal distributions, this isn't the case for all distributions. Often, it is very challenging (if not impossible) to find such closed-form expressions for different distributions. When this happens, you have to directly generate the n random variables, calculate , then , and finally  .
.
Running code (link also below) that runs such calculations to get for values between 0 and 3 for the lognormal distribution, you'll get a plot similar to Figure 2.

Figure 2: Plot of the lognormal distribution's κ-metric as σ increases using numerical calculations.
I may explore other distributions and their -metric values across varying parameter values just to see the different effects. For now, this is a good start, though.
Link to Code
The code used for calculating expressions and their results in this note can be found here.
Reference
The following are important references used and/or related to this note: